使用逻辑回归实现神经网络
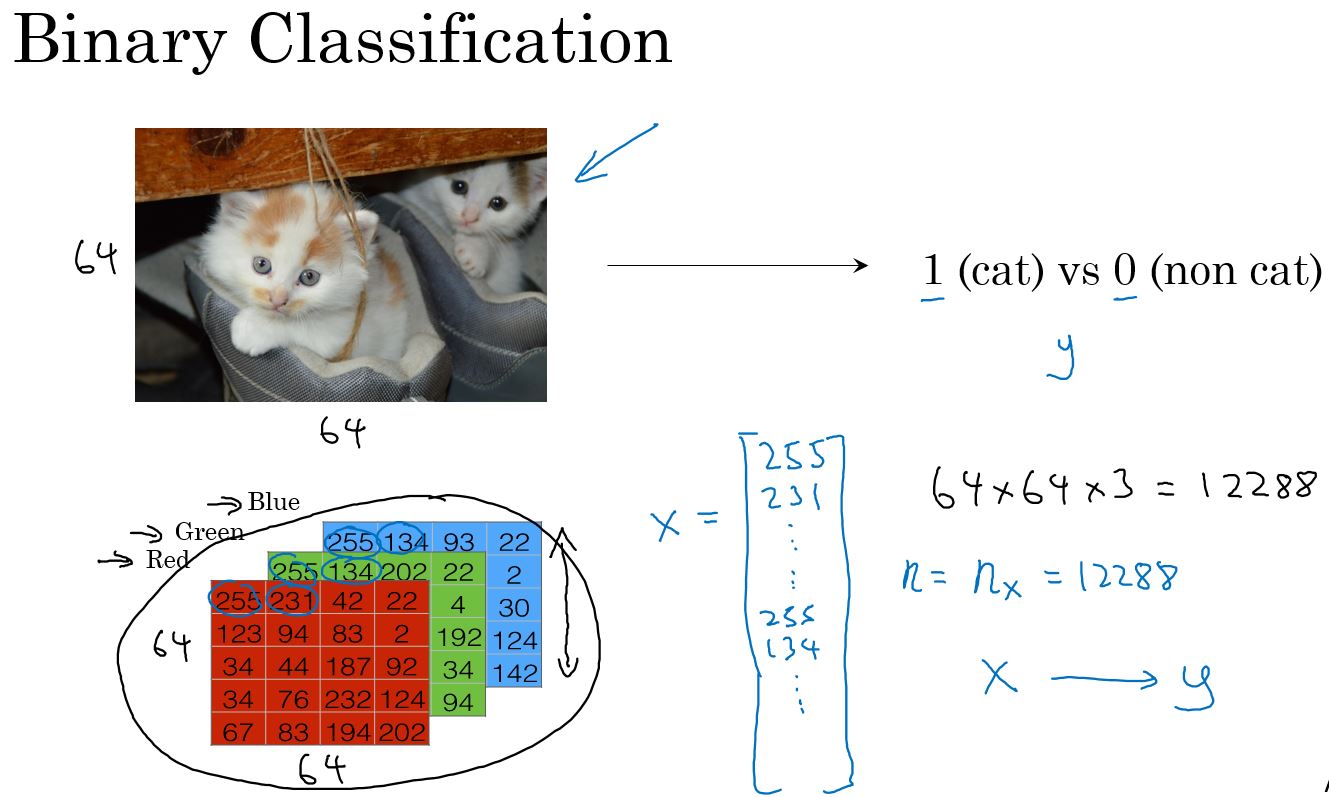
二分类问题
给一个输入,得到一个输出,输出的结果是0或1。
逻辑回归(Logistic Regression)
逻辑回归是一种学习算法,用于解决输出\(y\)为0或1的有监督学习问题。逻辑回归的目的是最小化预测值和训练数据值之间的差距。
示例:猫 vs 不是猫
给一个用向量\(x\)表示的图片,逻辑回归算法来评估此图片中物体是猫的概率。
\[ Griven \,\, x, \hat{y} = P(y = 1 | x) ,\,\,\,\, where \,\, 0 \le \hat{y} \le 1 \]
逻辑回归中使用到的参数有:
- 输入特征向量: \(x \in \mathbb{R}^{n_x },\,\, where \,\, n_x \,is \, the \, number \, of \, features\)
- 训练标签: $ y 0,1$
- 权重: \(w \in \mathbb{R}^{n_x },\,\, where \,\, n_x \,is \, the \, number \, of \, features\)
- 阈值: \(w \in \mathbb{R}\)
- 输出:$ ^{(i)} = ( w^T x + b) $
- Sigmoid函数: \[ s = \sigma( w^T x + b) = \sigma(z) =\frac{1}{1+e^{-z}} \]
sigmoid函数为:
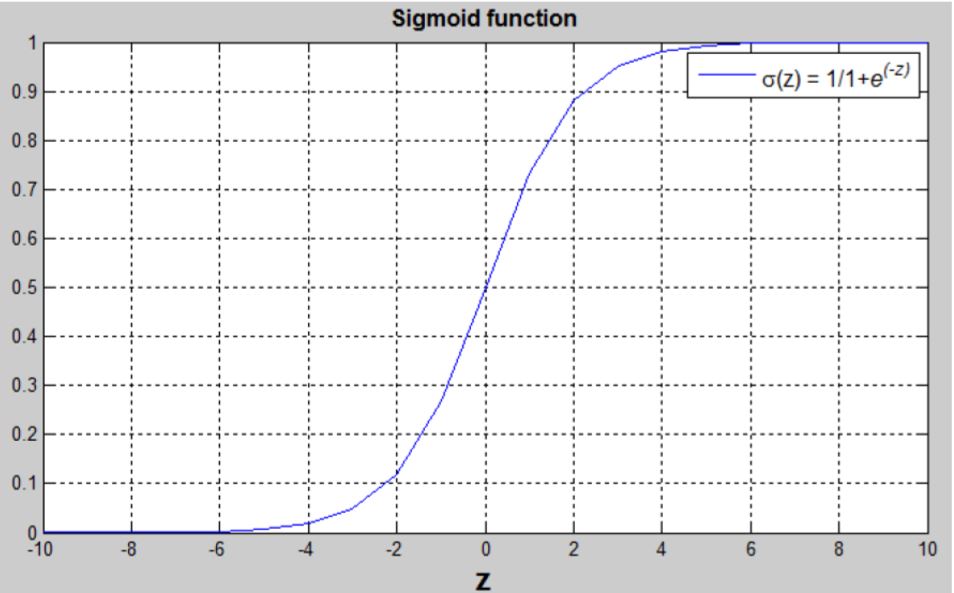
$ ( w^T x + b) $ 是一个线性函数 \((ax + b)\),但是我们要找的是一个在[0,1]的概率值,所以要使用sigmoid函数。这个函数会把结果约束在[0,1]。
逻辑回归的损失函数
为了训练逻辑回归中的\(w\)和\(b\),我们需要定义一个损失函数。
\[ \hat{y}^{(i)} = \sigma( w^T x^{(i)} + b) ,where \,\, \sigma(z^{(i)}) =\frac{1}{1+e^{-z^{(i)}}} \]
\[ Given \,\, {(x^{(1)},y^{(1)}),\ldots, (x^{(m)},y^{(m)})}, we\, want \,\,\hat{y^{(i)}} \simeq y^{(i)} \]
损失函数(Loss Function)
损失函数衡量了预测值($ ^{(i)} \()和期望值(\) y^{(i)}$)之间的差值。
\[ \mathcal{L}(a^{(i)}, y^{(i)}) = \frac{1}{2} (\hat{y}^{(i)} -y^{(i)})^2 \]
\[ \mathcal{L}(\hat{y}^{(i)}, y^{(i)}) = - (y^{(i)} \log(\hat{y}^{(i)}) + (1-y^{(i)} ) \log(1-\hat{y}^{(i)})) \]
- 如果\(y^{(i)} = 1\):$ (^{(i)}, y^{(i)}) = - (^{(i)}) \(,使\) (^{(i)}, y{(i)})\(越小,\){(i)}$应该越接近1
- 如果\(y^{(i)} = 0\):$ (^{(i)}, y^{(i)}) = - (1 - ^{(i)}) \(,使\) (^{(i)}, y{(i)})\(越小,\){(i)}$应该越接近0
代价函数(Cast Function)
代价函数是训练集中每个实例的损失函数的平均值。我们需要找到参数\(w\)和\(b\)使得总体的代价函数最小。
计算公式为:
\[ \begin{aligned} J(w,b) & = -\frac{1}{m}\sum_{i=1}^{m}[\mathcal{L}(\hat{y}^{(i)}, y^{(i)})] \\ & = -\frac{1}{m}\sum_{i=1}^{m}[y^{(i)}\log(\hat{y}^{(i)})+(1-y^{(i)})\log(1-\hat{y}^{(i)})] \end{aligned} \]
导数
课程中很了很多时间举了很多例子用极值法求导数,是针对没有经验的人。可以使用公式,这里就不记录了。
计算图
计算图描述计算过程,方便清晰查看计算过程。
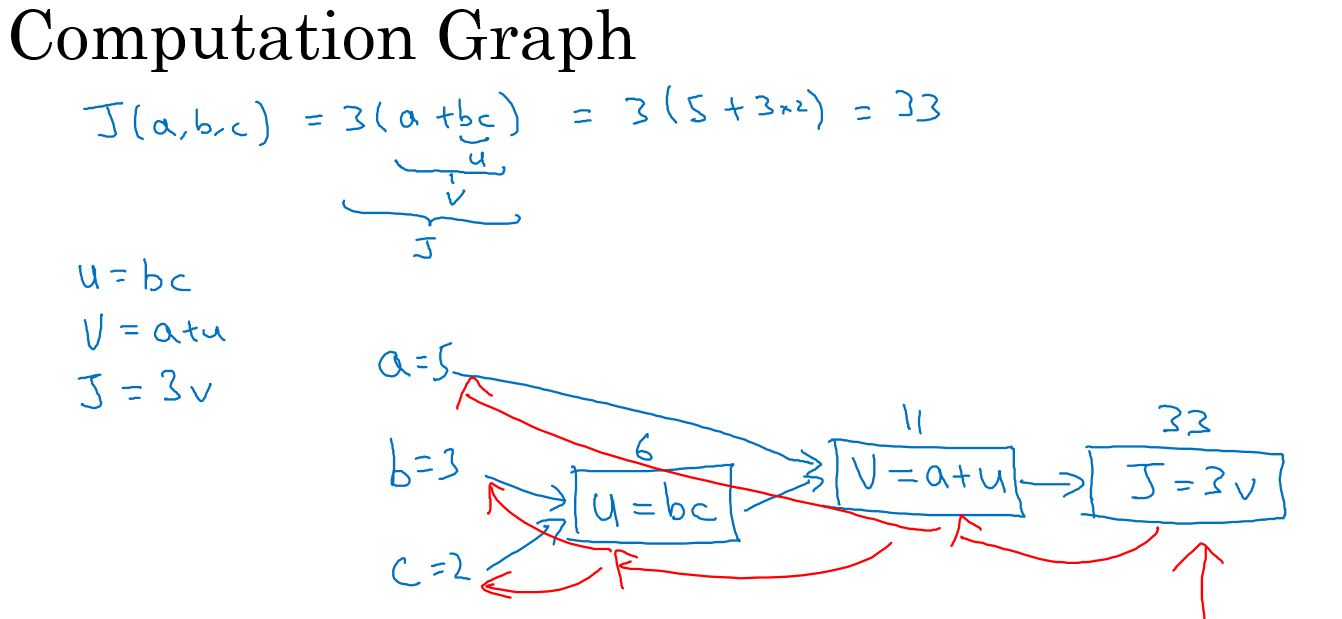
计算图计算导数
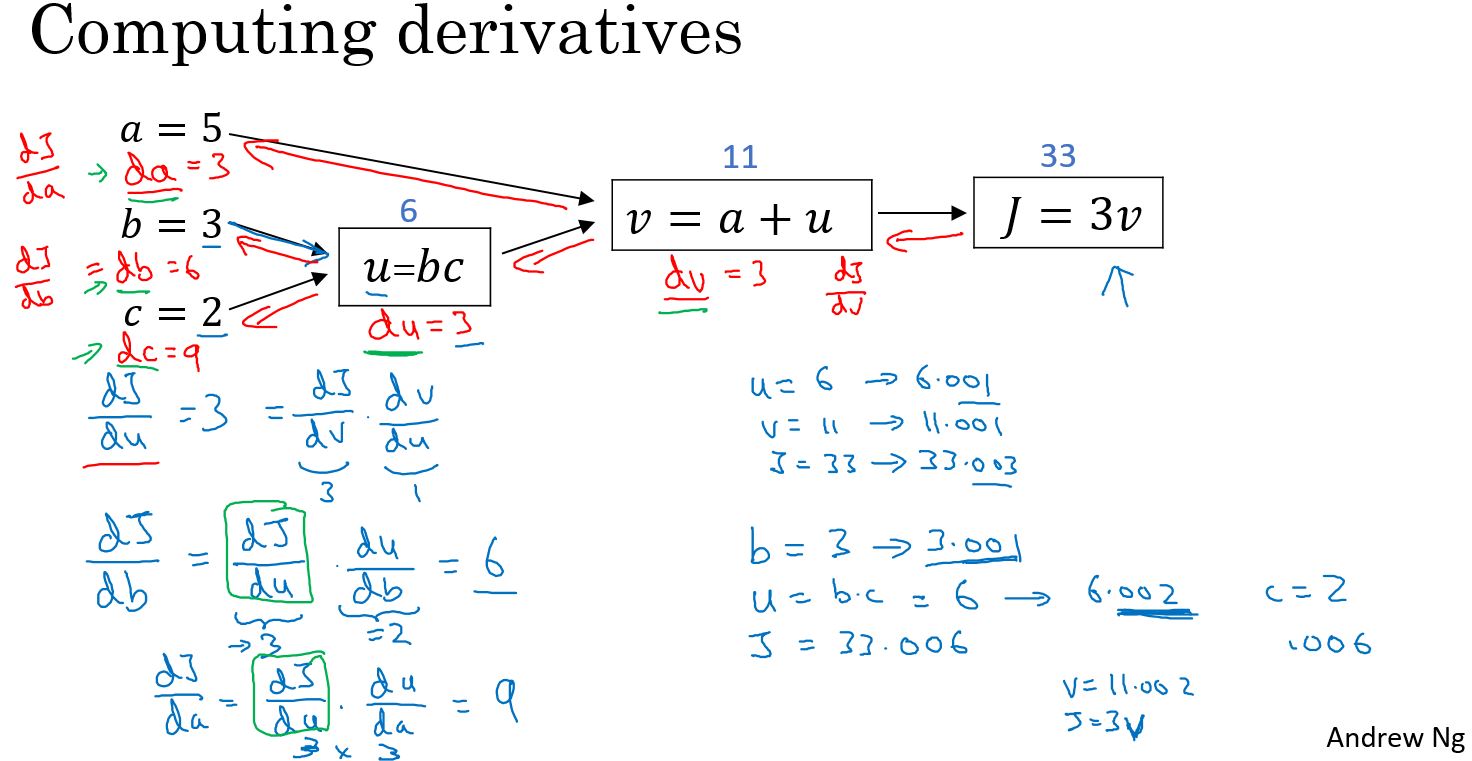
逻辑回归的导数计算
逻辑回归的计算图为:

$ z = w^T x + b = w_1 x_1 + w_2 x_2 + b $
$ = a = (z) $
$ (a, y) = - y (a) - (1-y ) (1-a) $
我们的目的是计算\(\mathcal{L}\)对\(w\)和\(b\)的导数,这样才能通过梯度下降法更新参数并使损失函数\(\mathcal{L}\)不断降低。
通过计算图,我们可以从后往前计算导数:
\[ \begin{aligned} da & = \frac{d\mathcal{L}}{da} \\ & = -\frac{y}{a} + \frac{1-y}{1-a} \end{aligned} \]
| \[ \begin{aligned} dz &= \frac{d\mathcal{L}}{dz} \\ &= \frac{d\mathcal{L}}{da}\frac{da}{dz} \\ & = (-\frac{y}{a} + \frac{1-y}{1-a})(a(1-a)) \\ & = -{y}(1-a) + (1-y)a \\ & = a - y \end{aligned} \] |
| > 注:使用到求导数的链式法则。 |
| > 注2: |
| \[ \begin{aligned} \frac{da}{dz} &= \frac{d\sigma{(z)}}{dz}\\ & = (\frac{1}{1+e^{-z}})' \\ & = \frac{(1)'(1+e^{-z}) - 1 ({1+e^{-z}})'}{(1+e^{-z})^2} \\ & = \frac{e^{-z}}{(1+e^{-z})^2} \\ & = \frac{1+e^{-z} - 1}{(1+e^{-z})^2} \\ & = \frac{1}{1+e^{-z}} ( \frac{1+e^{-z} - 1}{(1+e^{-z})}) \\ & = \frac{1}{1+e^{-z}} ( 1 - \frac{1}{1+e^{-z}}) \\ & = a(1 - a) \end{aligned} \] |
| > 注3: |
| \[ \begin{aligned} (\frac{u}{v})' &= \frac{u'v - uv'}{v^2}\\ \end{aligned} \] |
\[ \begin{aligned} dw_1 &= \frac{d\mathcal{L}}{dw_1} \\ &= \frac{d\mathcal{L}}{dz}\frac{dz}{dw_1} \\ & = (a-y)x_1 \end{aligned} \]
\[ \begin{aligned} dw_2 &= \frac{d\mathcal{L}}{dw_2} \\ &= \frac{d\mathcal{L}}{dz}\frac{dz}{dw_2} \\ & = (a-y)x_2 \end{aligned} \]
\[ \begin{aligned} db &= \frac{d\mathcal{L}}{db} \\ &= \frac{d\mathcal{L}}{dz}\frac{dz}{db} \\ & = (a-y) \end{aligned} \]
更新参数
$ w_1 = w_1 - dw_1 $
$ w_2 = w_2 - dw_2 $
$ b = b - db $
上面的例子就是使用梯度下降法来实现对逻辑回归问题的求解。
\(m\)个实例的梯度下降法计算
对深度学习来说,一般训练集都会有多个实例,训练时要在这多个实例上进行,那么计算时就需要在\(m\)个实例上都计算一次。
对于每一个实例 \(x^{(i)}\):
\[ z^{(i)} = w^T x^{(i)} + b \]
\[ \hat{y}^{(i)} = a^{(i)} = sigmoid(z^{(i)}) \]
\[ \mathcal{L}(a^{(i)}, y^{(i)}) = - y^{(i)} \log(a^{(i)}) - (1-y^{(i)} ) \log(1-a^{(i)}) \]
代价函数则是把所有实例的损失函数求和:
\[ J = \frac{1}{m} \sum_{i=1}^m \mathcal{L}(a^{(i)}, y^{(i)}) \]
计算方法
按照传统的计算方法,使用循环进行每个实例的计算。
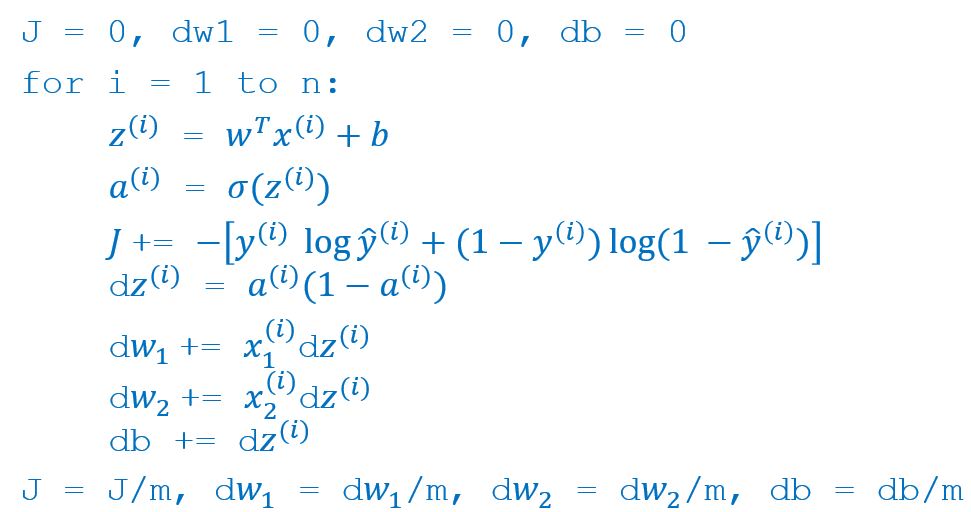
显然,在对运算速度要求很高的深度学习中,通过循环每次进行一个数据的计算,这种效率是非常低的。
下面通过矢量化提高计算速度。
深度学习编程准则:
Whenever possible, avoid explicit for-loops.
矢量化
对输入中的每个实例\(X^{(i)}\) 排成一行:
\[ X = [X^{(1)} \,\, X^{(2)} \cdots \, X^{(m)}] \]
其中每个\(X^{(i)}\)是 \[ \begin{bmatrix} x_{1} \\ x_{2} \\ \vdots \\ x_{n_x} \end{bmatrix} \]
把上面的每个权值\(w_{i}\) 排成一列:
\[ w = \begin{bmatrix} w_{1} \\ w_{2} \\ \vdots \\ w_{n_x} \end{bmatrix} \]
这个就是矢量化。用一个向量或者矩阵(2维矩阵)或者张量(Tensor,3维及以上的矩阵)表示多个变量。
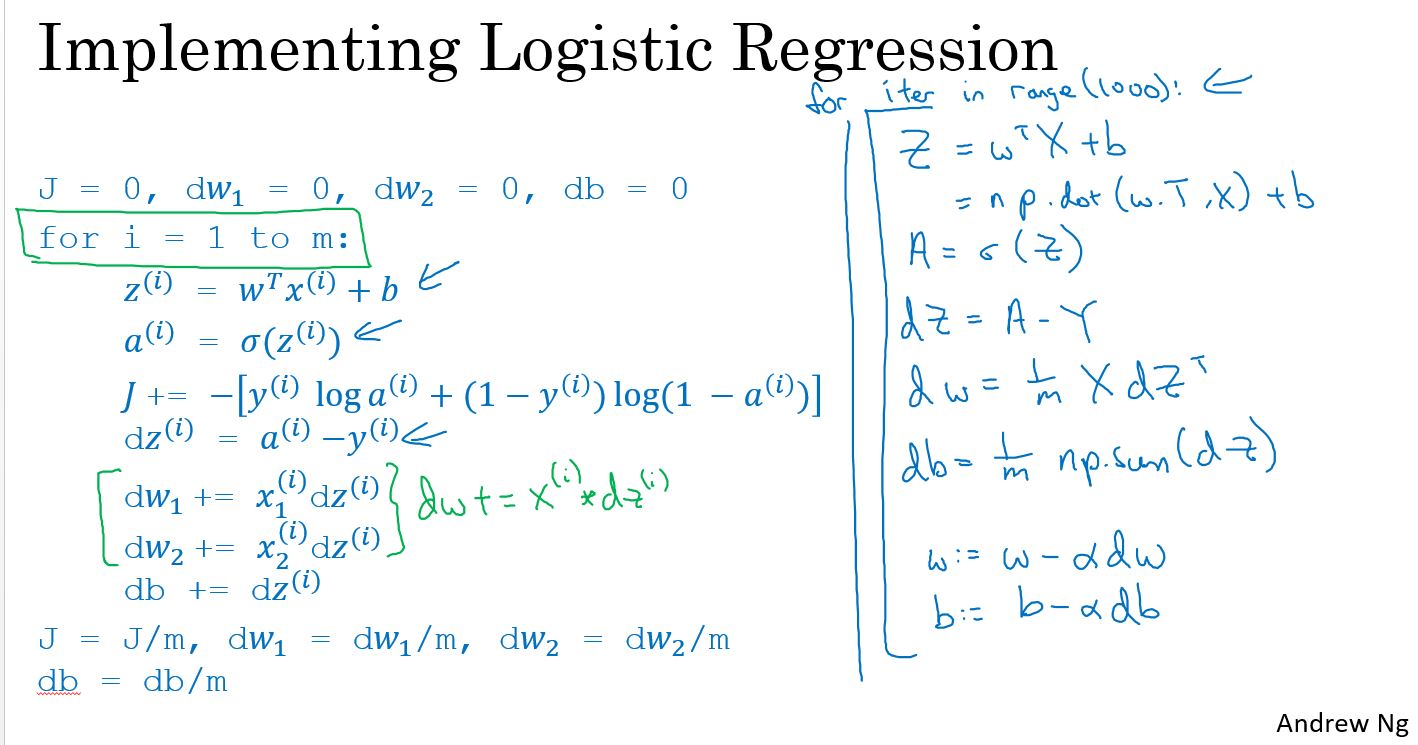
矢量化后的前向计算
- 得到输入\(X\),\(m\)个实例,每个实例的输入长度是\(n_x\) \[ X = \left[ \begin{matrix} x_{1\_1} & x_{2\_1} & \cdots & x_{m\_1} \\ x_{1\_2} & x_{2\_1} & \cdots & x_{m\_1} \\ \vdots & \vdots & \ddots & \vdots \\ x_{1\_n_x} & x_{2\_n_x} & \cdots & x_{m\_n_x} \\ \end{matrix} \right] \]
- 前向计算: \[ A = \sigma(w^T X + b) = (a^{(1)}, a^{(2)}, ..., a^{(m)}) \]
- 计算损失函数: \[ J = -\frac{1}{m}\sum_{i=1}^{m}y^{(i)}\log(a^{(i)})+(1-y^{(i)})\log(1-a^{(i)}) \]
矢量化后的梯度计算
\[ dw = \frac{\partial J}{\partial w} = \frac{1}{m}X(A-Y)^T \] \[ db = \frac{\partial J}{\partial b} = \frac{1}{m} \sum_{i=1}^m (a^{(i)}-y^{(i)}) \]
矢量化后的参数更新
\[ w = w - \alpha * dw \]
\[ b = b - \alpha * db \]
编程练习
本周的编程练习是实现一个简单的逻辑回归模型,输入是一副(64,64)的RGB图像,通过逻辑回归判断此图像是否是一只猫。
分步构建我们的算法
构建神经网络的主要步骤为:
- 1.Define the model structure (such as number of input features)
- 2.Initialize the model's parameters
- 3.Loop:
- 1.计算损失值Calculate current loss (forward propagation)
- 2.计算梯队Calculate current gradient (backward propagation)
- 3.更新参数Update parameters (gradient descent)
这个步骤也是大部分网络的基本计算步骤,非常常用。
实现辅助函数
使用numpy实现 sigmoid() 函数. 计算公式为:
\[ sigmoid( z ) = \frac{1}{1 + e^{-z}} \]
1 | # sigmoid |
初始化参数
把参数初始化为0.
1 | # initialize_with_zeros |
实现前向传播
下面要实现逻辑回归的前向传播。
Exercise: 实现函数 propagate() 计算损失值和梯度。
前向传播的公式为:
- 输入 X
- 计算逻辑推理值: \(A = \sigma(w^T X + b) = (a^{(0)}, a^{(1)}, ..., a^{(m-1)}, a^{(m)})\)
- 计算损失值: \(J = -\frac{1}{m}\sum_{i=1}^{m}y^{(i)}\log(a^{(i)})+(1-y^{(i)})\log(1-a^{(i)})\)
下面是计算梯度的公式:
\[ \frac{\partial J}{\partial w} = \frac{1}{m}X(A-Y)^T \]
\[ \frac{\partial J}{\partial b} = \frac{1}{m} \sum_{i=1}^m (a^{(i)}-y^{(i)}) \]
1 | # propagate |
优化
上面已经实现了初始化参数和计算损失值及其梯度。 现在,要实现使用梯度下降法更新梯度。
实现 optimizate() 函数。 目标是通过最小化损失函数 \(J\) 来学习 \(w\) 和 \(b\) 。对于参数 \(\theta\), 更新参数的规则是 $ = - d$, 其中 \(\alpha\) 学习率。
1 | # optimize |
合并所有的实现为model
把上面所有的实现按正确的顺序组合为model,就可以实现逻辑回归模型了。
实现 model() 函数,使用下面的符合标记:
- Y_prediction :在测试集上的预测值;
- Y_prediction_train :在训练集上的预测值;
- w, costs, grads : 函数
optimize()的输出
1 | # model |
这个模型中包含了:
- 参数初始化
- 模型训练
- 模型预测(在训练集和测试集上)
运行如下代码训练模型和使用模型进行预测:
1 | d = model(train_set_x, train_set_y, test_set_x, test_set_y, num_iterations = 2000, learning_rate = 0.005, print_cost = True) |
结果为: 1
2train accuracy: 99.04306220095694 %
test accuracy: 70.0 %
训练集上的准确率基本接近100%。但是在测试集上的准确率并不太高。但是对于一个简单的模型,使用的是一个小的数据集并且使用简单的逻辑回归进行实现的,这个表现并不算差。下周的课程会构建一个更好的模型。
这是一个明显的过拟合(overfitting),后面我们会学习如何降低过拟合,比如使用正则化(regularization)。
进一步分析
我们已经实现了第一个图像分类模型,可以进一步分析,如何选择一个学习率(learning rate) \(\alpha\) 。
学习率的选择
提醒: 为了使梯度下降法更好的工作,需要明智的选择学习率。学习率决定了更新参数的速度。如果学习率过大,则可能越过最佳值。同样的,如果学习率过小,可能需要更多的迭代次数才能收敛到最佳值。这就是为什么需要精心调节学习率的原因。
运行下面的代码,可以查看不同学习学习率下,损失函数和迭代次数的关系曲线。
1 | learning_rates = [0.01, 0.001, 0.0001] |
结果为:
1 | learning rate is: 0.01 |
解释:
不同的学习率会得到不同的损失函数和不同的预测结果。 如果学习率过大,比如0.01,损失函数会震荡的上和下,甚至会偏离(尽管在这个例子中最终得到了一个较好的损失值,但是这个学习率并不是一个好的选择)。 低的损失值并不意味着一个好的模型。可以检查这个模型是否存在过拟合。这个模型的训练集准确率会比测试的准确率高很多。 在深度学习中,推荐的做法是:选择更好地最小化成本函数的学习速率。 如果模型存在过拟合,使用其他的一些方法减少过拟合。
测试自己的图片
可以通过如下方法测试自己的输入图片是否是一只猫。
1 | my_image = "my_image.jpg" # change this to the name of your image file |
在此练习中要记住的是:
- 预处理数据集很重要
- 分别实现每个函数,然后组合成modle.
- 调节学习率会使算法有所不同。
在这个练习中还有如下事情可以尝试:
- 调节学习率和迭代次数
- Play with the learning rate and the number of iterations
- 尝试不同的初始化方法然后比较结果
- Try different initialization methods and compare the results
- 测试其他的预处理数据方法(center the data, or divide each row by its standard deviation)
参考
http://www.wildml.com/2015/09/implementing-a-neural-network-from-scratch/
https://stats.stackexchange.com/questions/211436/why-do-we-normalize-images-by-subtracting-the-datasets-image-mean-and-not-the-c
小结
本周的课程主要是通过逻辑回归的例子来引入神经网络相关的概念,比如前向计算、反向传播、梯度下降法、计算图、激活函数等。
梯度下降法是一个求解问题的方法,不仅仅用在神经网络中,对逻辑回归的问题也可以使用。
关于梯度下降法,我也总结的一篇博客,有兴趣可以参考:深度学习_2_梯度下降法 。